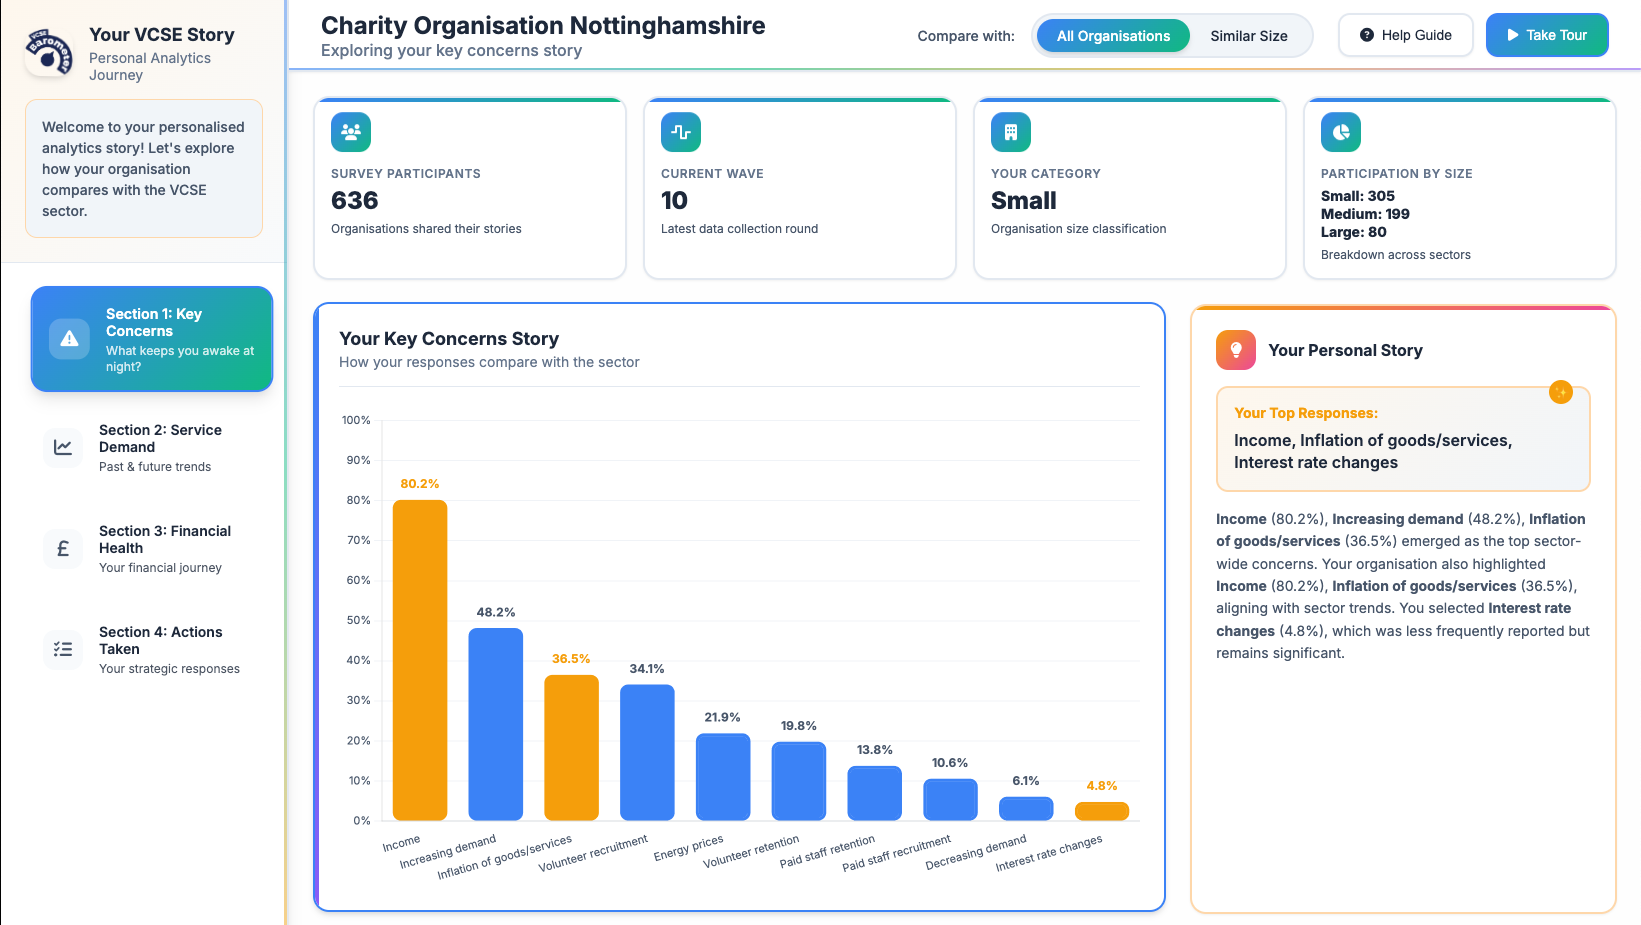
Individualised Report
A tailored report providing each participating organisation with a private, data-driven analysis of their survey results, benchmarked against sector-wide trends. Designed to support strategic decision-making with clear visuals and actionable insights.
Individualised Bilingual Report
A tailored report providing each participating organisation with a private, data-driven analysis of their survey results, benchmarked against sector-wide trends. Designed to support strategic decision-making with clear visuals and actionable insights.
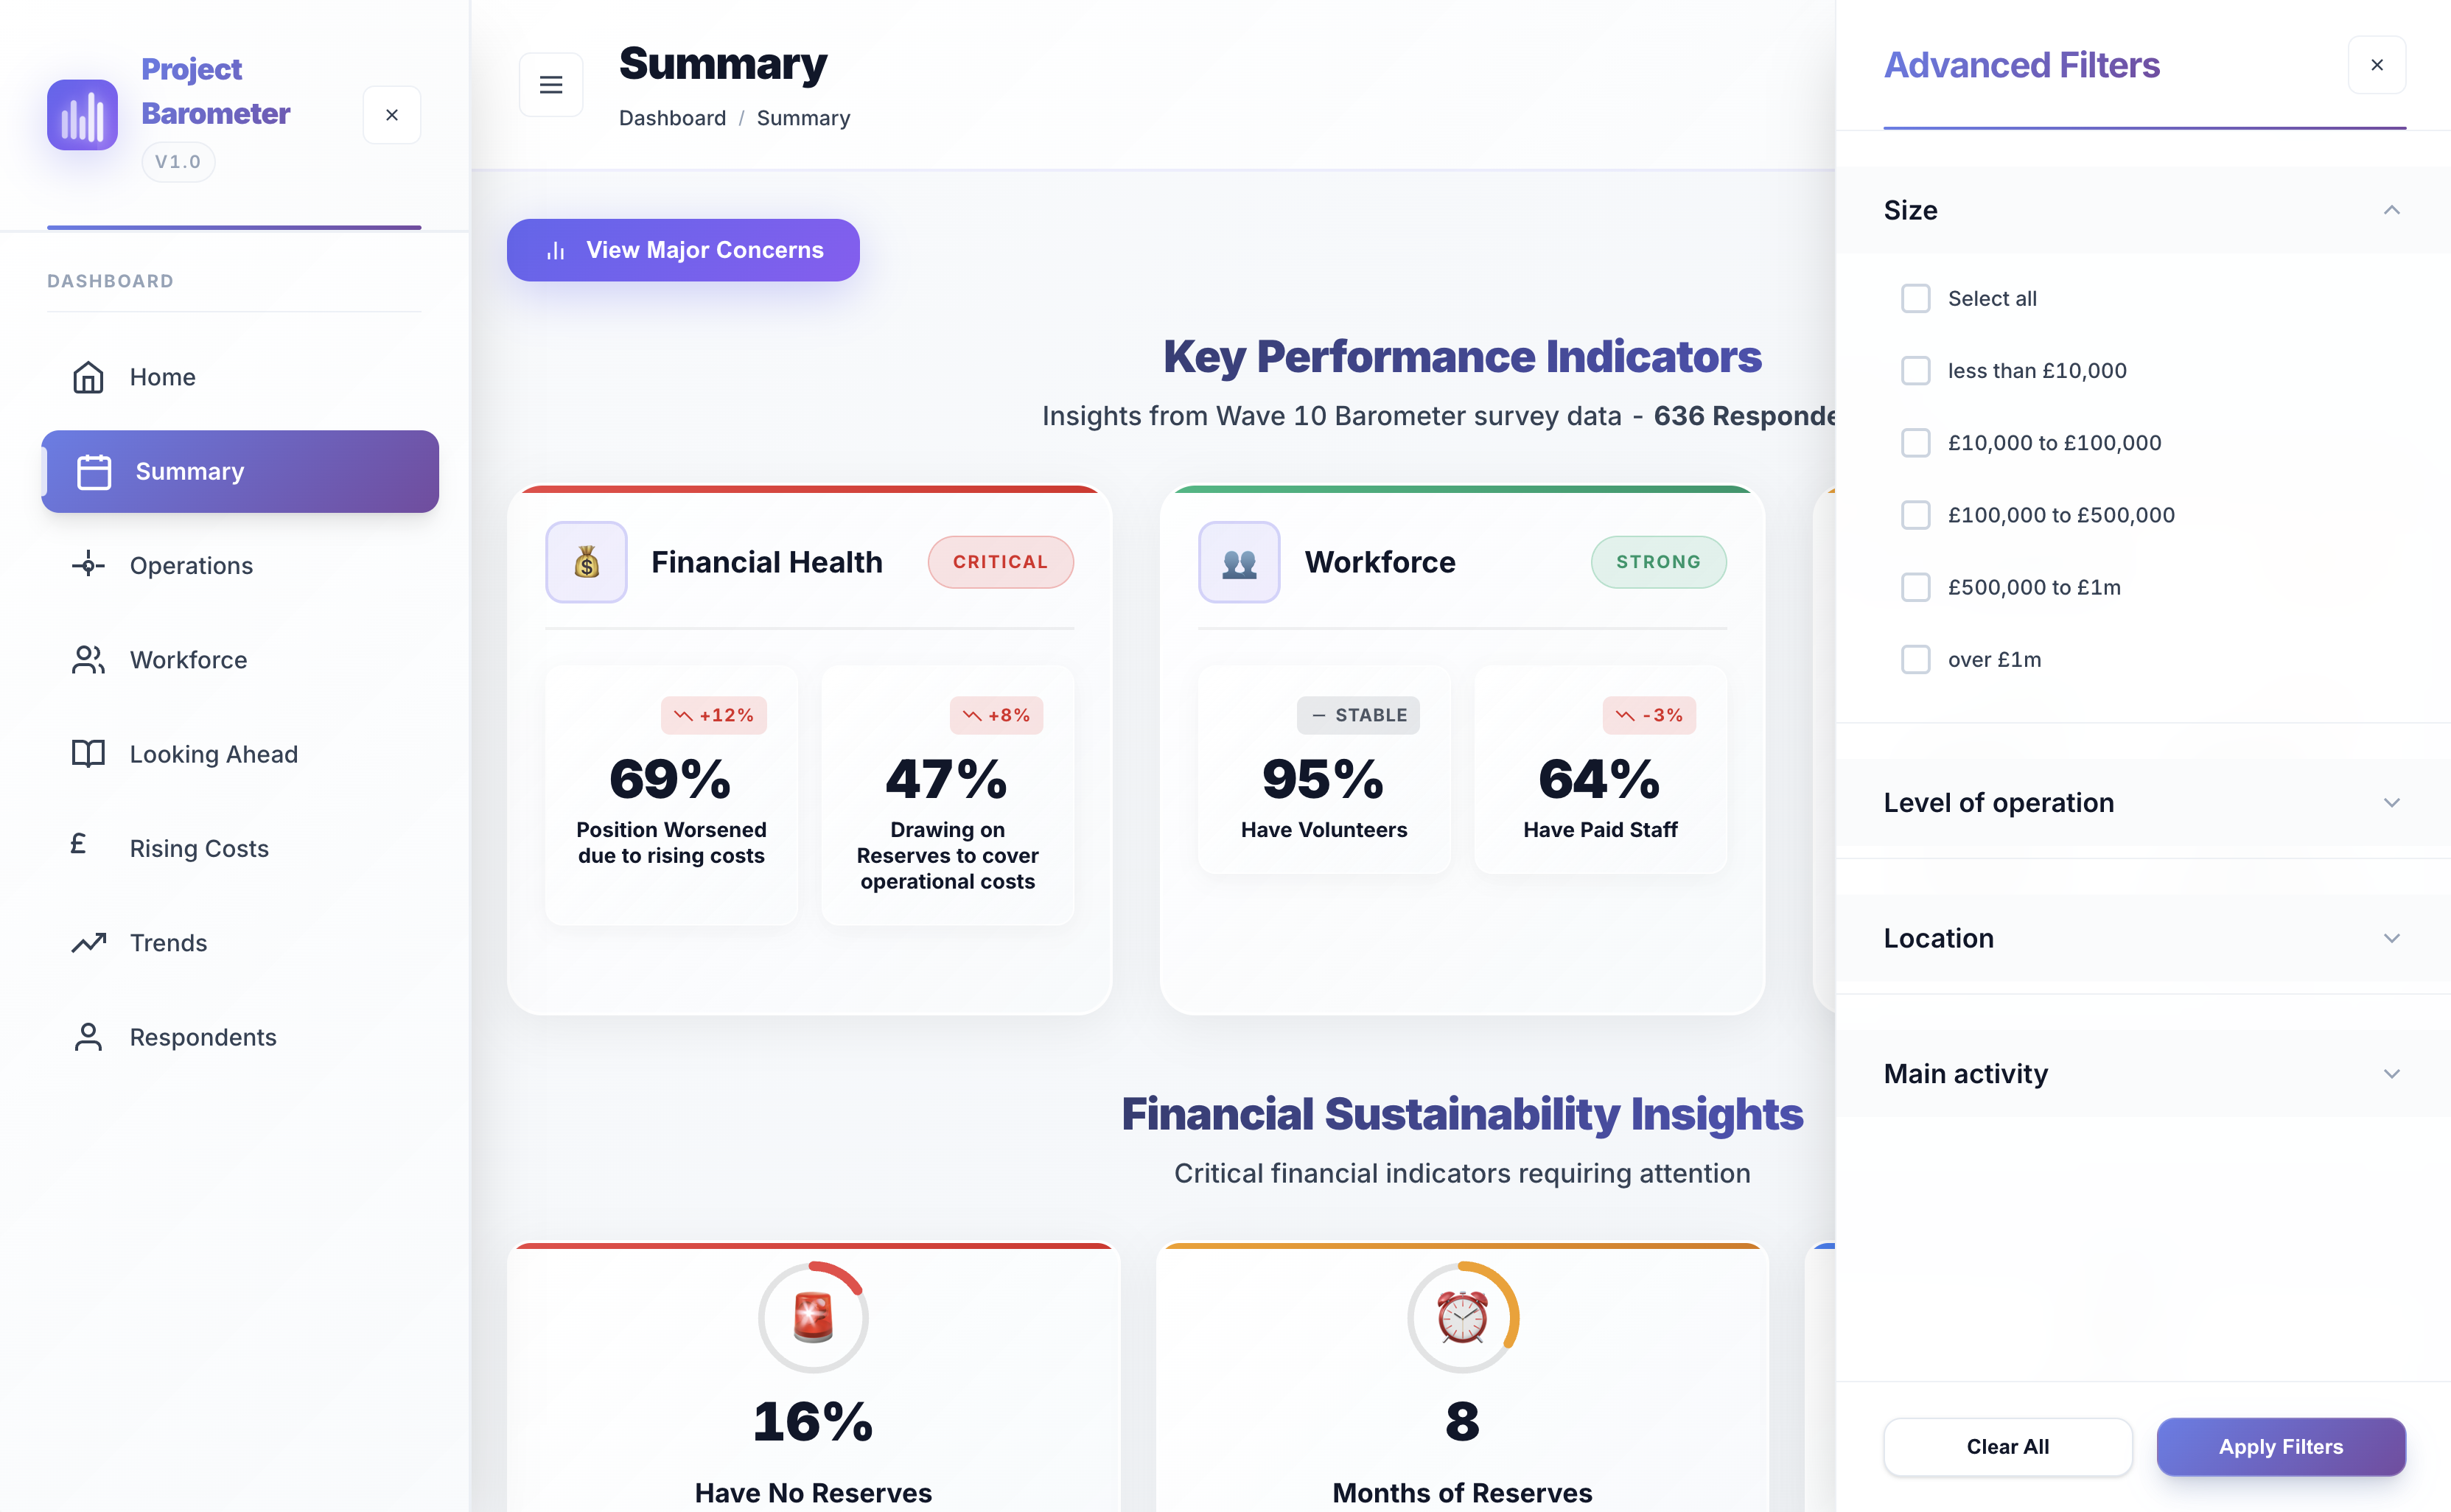
Barometer Dashboard
An interactive platform presenting the latest VCSE Barometer survey findings, with real-time data visualisation, thematic analysis, and sector benchmarks. Enables exploration of trends in service demand, funding, workforce, and more.
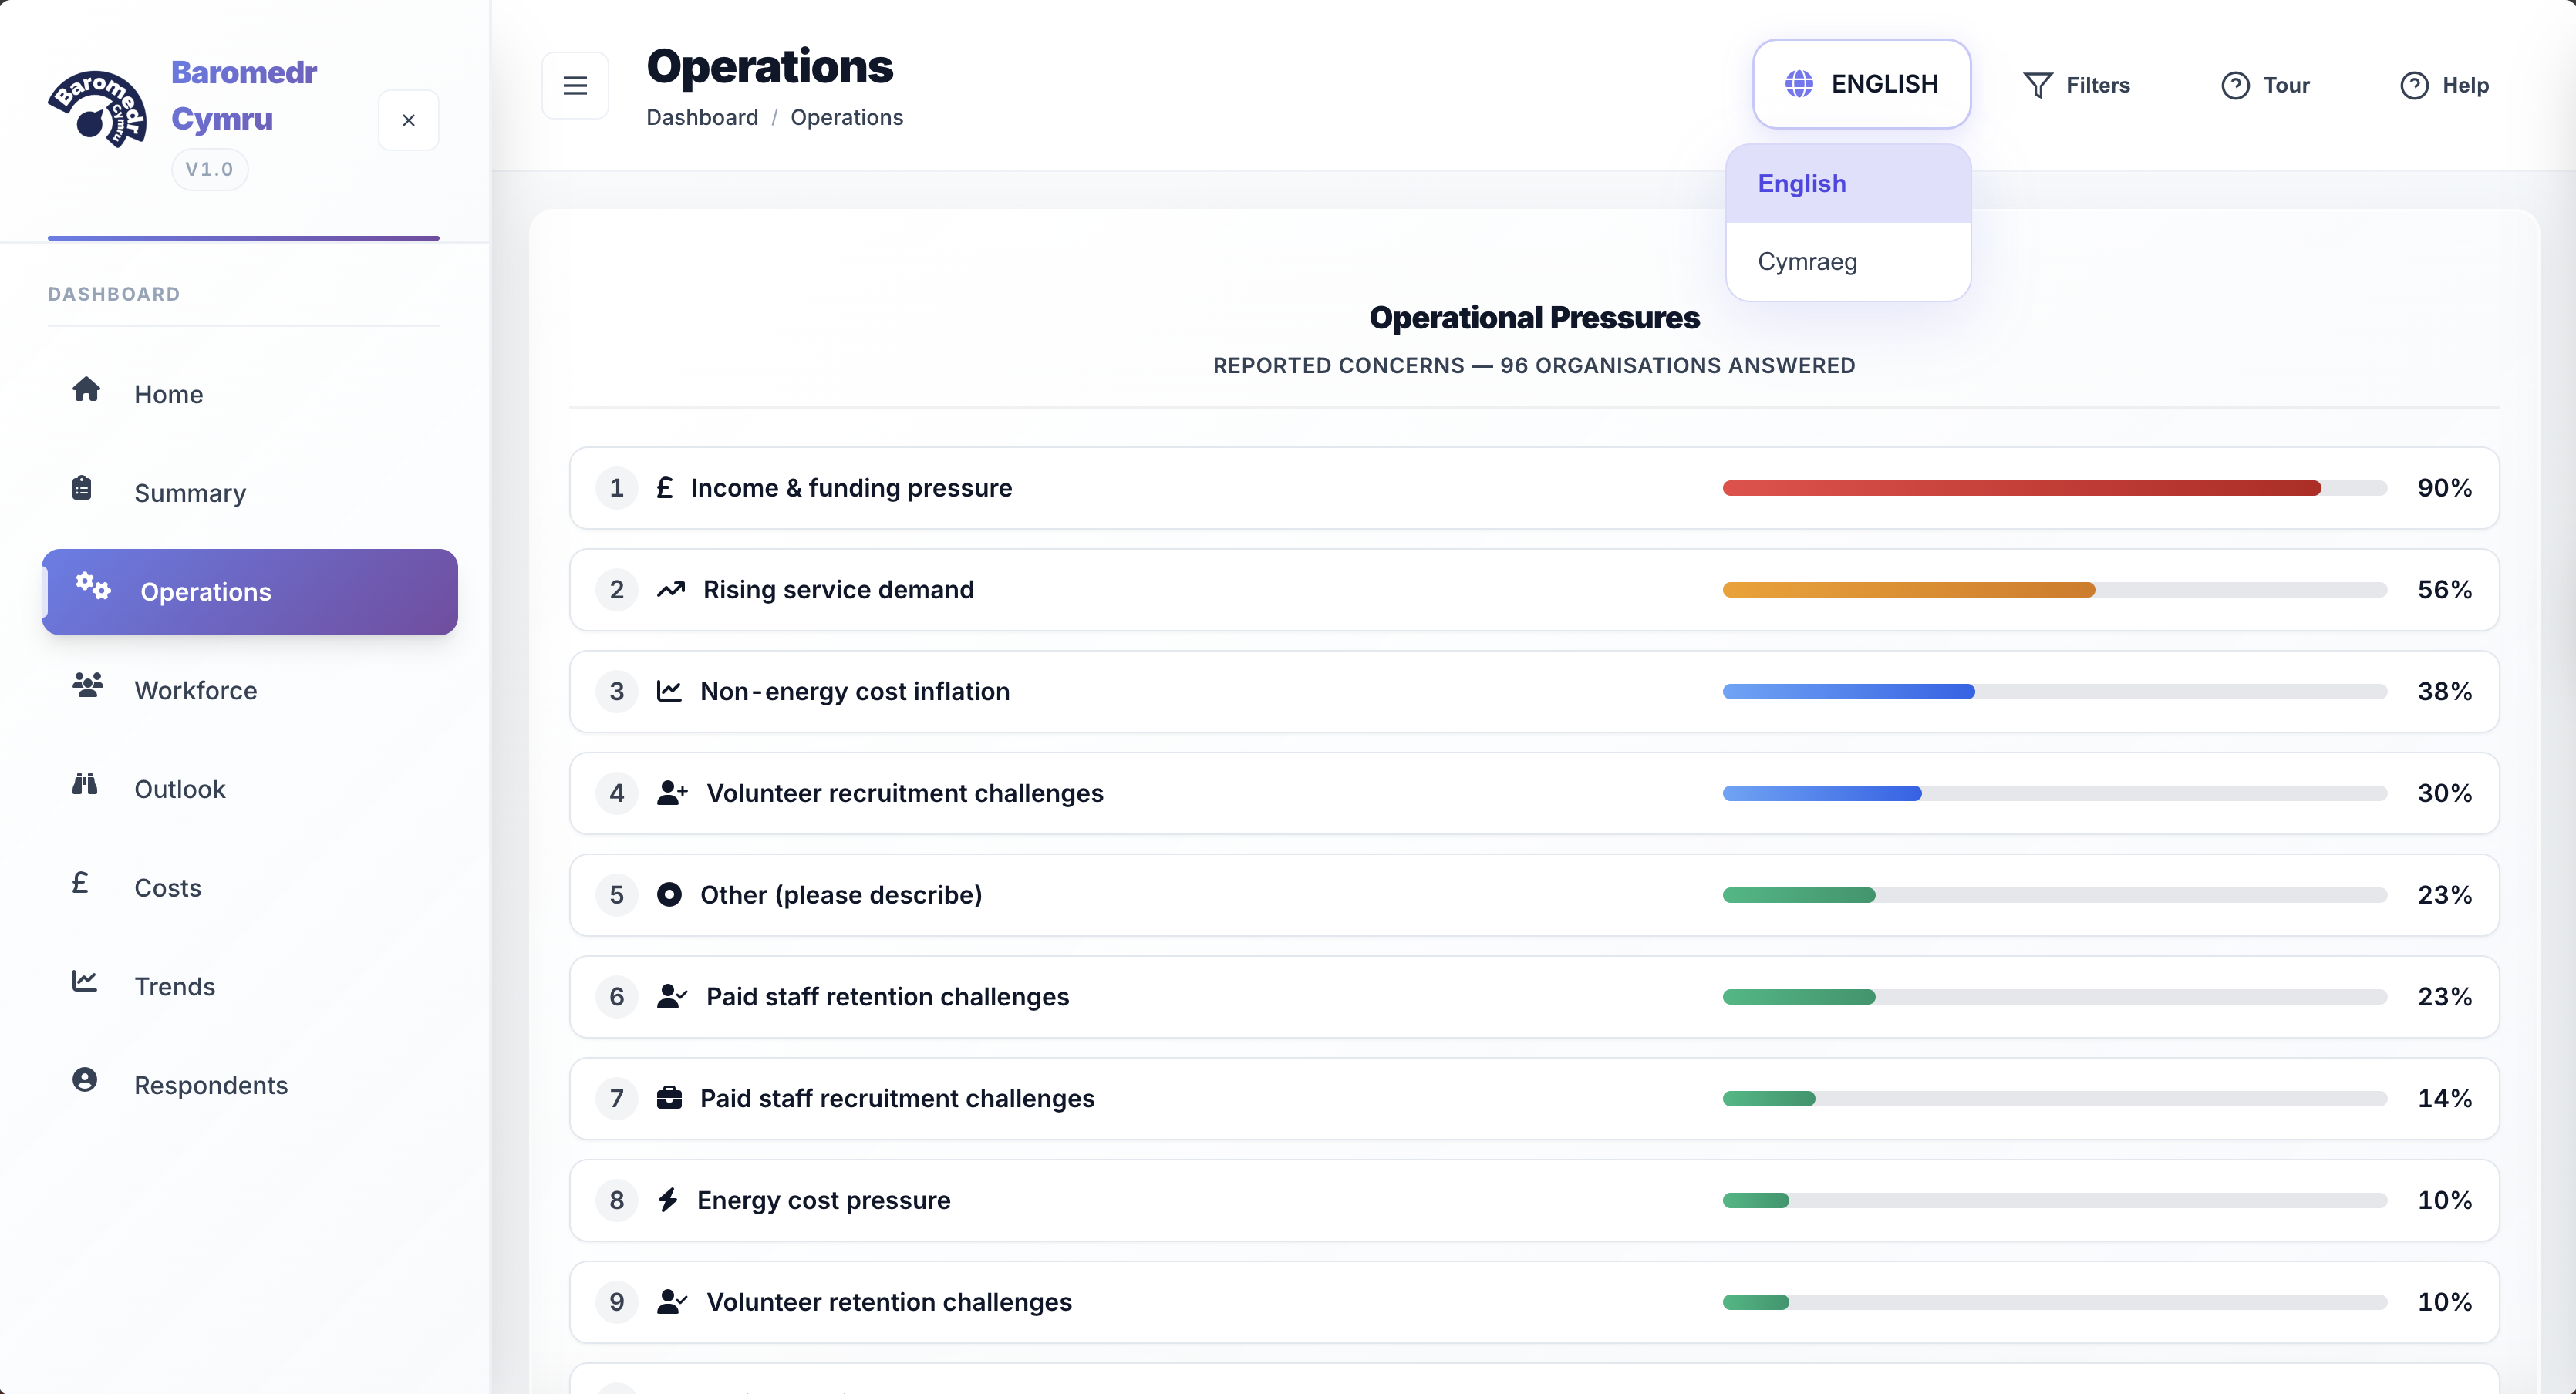
Baromedr Dashboard
An interactive platform presenting the latest VCSE Barometer survey findings, with real-time data visualisation, thematic analysis, and sector benchmarks. Enables exploration of trends in service demand, funding, workforce, and more.
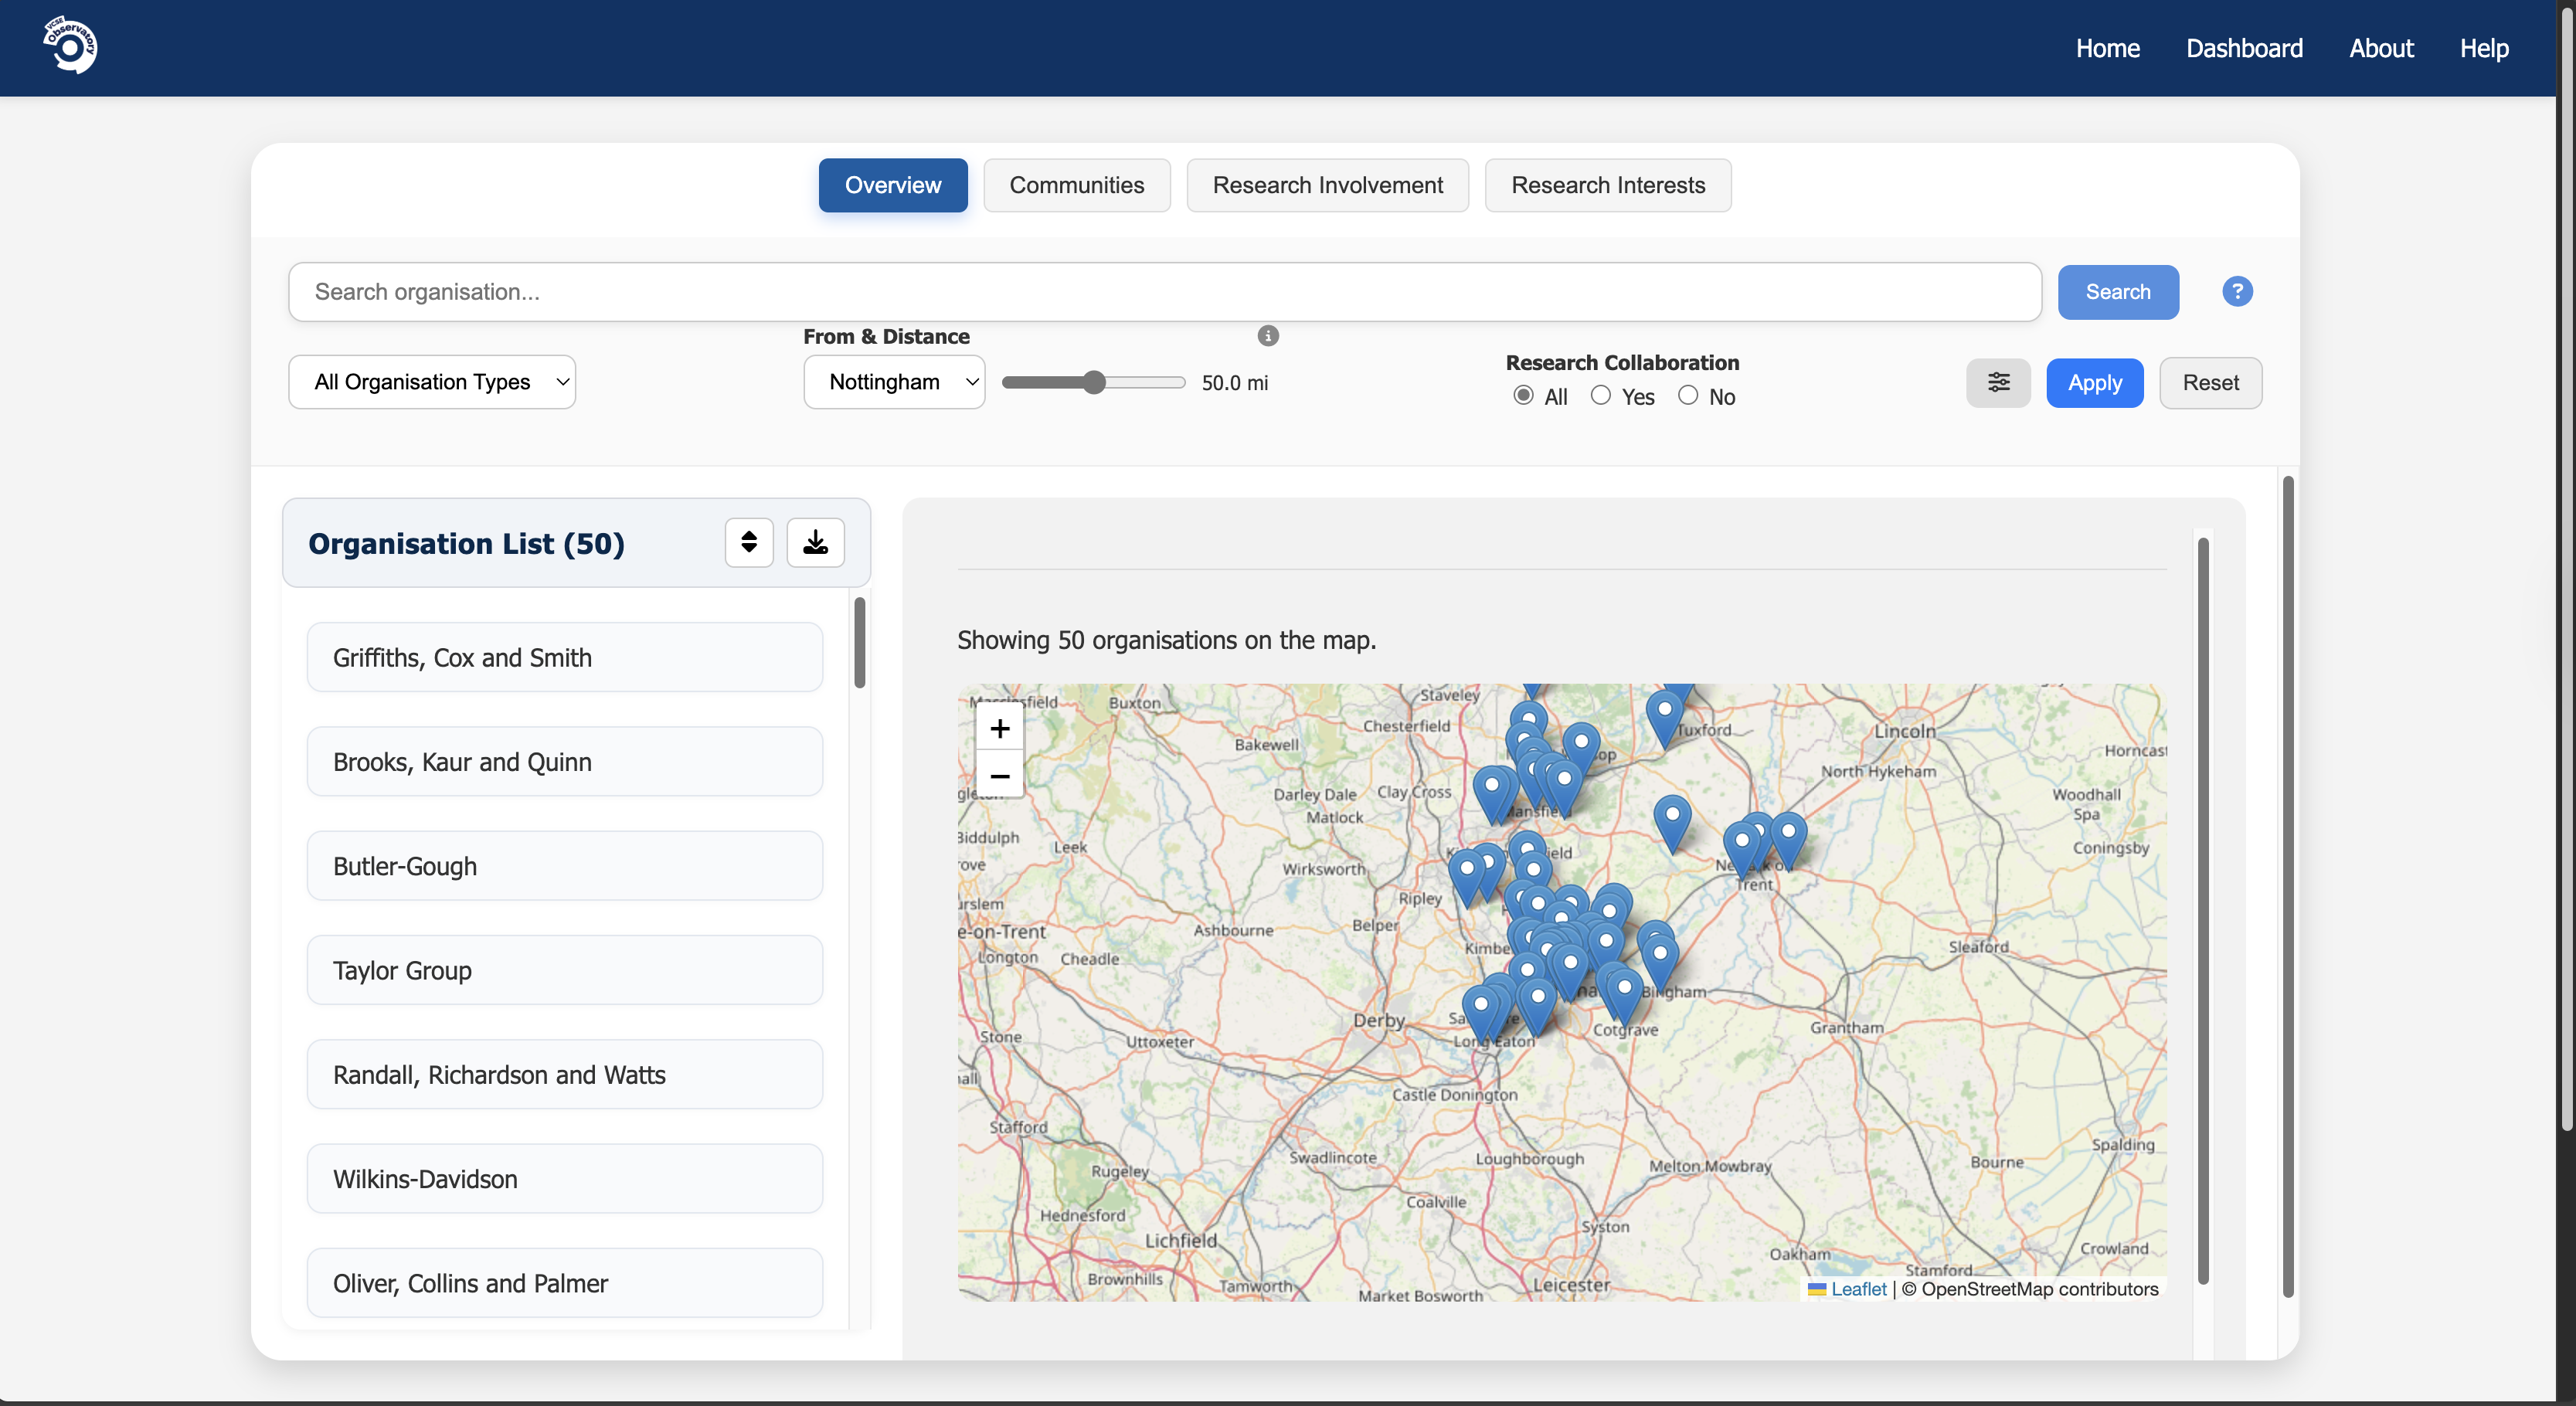
REN Dashboard
A mapping and analysis tool for the Research Engagement Network, showing geographic reach, organisational connections, and thematic focus areas across the UK. Supports collaboration and evidence-based engagement.
ESRC Project – Unlocking Community Insight
This project addresses a common concern that academic research can feel extractive, taking insights without giving back to communities. By working with VCSE organisations, we aim to shift the balance—making data collection and sharing more reciprocal, ethical, and genuinely useful to the sector.