As we celebrate Small Charity Week, it is a good opportunity to reflect on the huge contribution small charities make and the challenges they are facing. Many are experiencing pressure from rising demand, funding challenges and volunteer recruitment difficulties.
If you’re involved in a small VCSE (voluntary, community and social enterprise) organisation or group, you may have asked yourself:
'Are other organisations and groups seeing demand increase like we are?'
'Are others facing similar financial challenges to us?'
'Are others also struggling to recruit volunteers?'
These important questions can be tricky to answer when your focus needs to be on delivering services, supporting communities and keeping your small organisation or group going.
The VCSE Barometer Dashboard provides real time, accessible and free to use data and infographics on the sector which can help answer these kinds of questions. Every quarter around 400 to 600 VCSE organisations and groups share their experiences of demand for services, financial outlook, operational risk, workforce issues and volunteering. Most of the responses to the VCSE Barometer surveys come from small VCSE organisations and groups, so the data is especially useful for them.
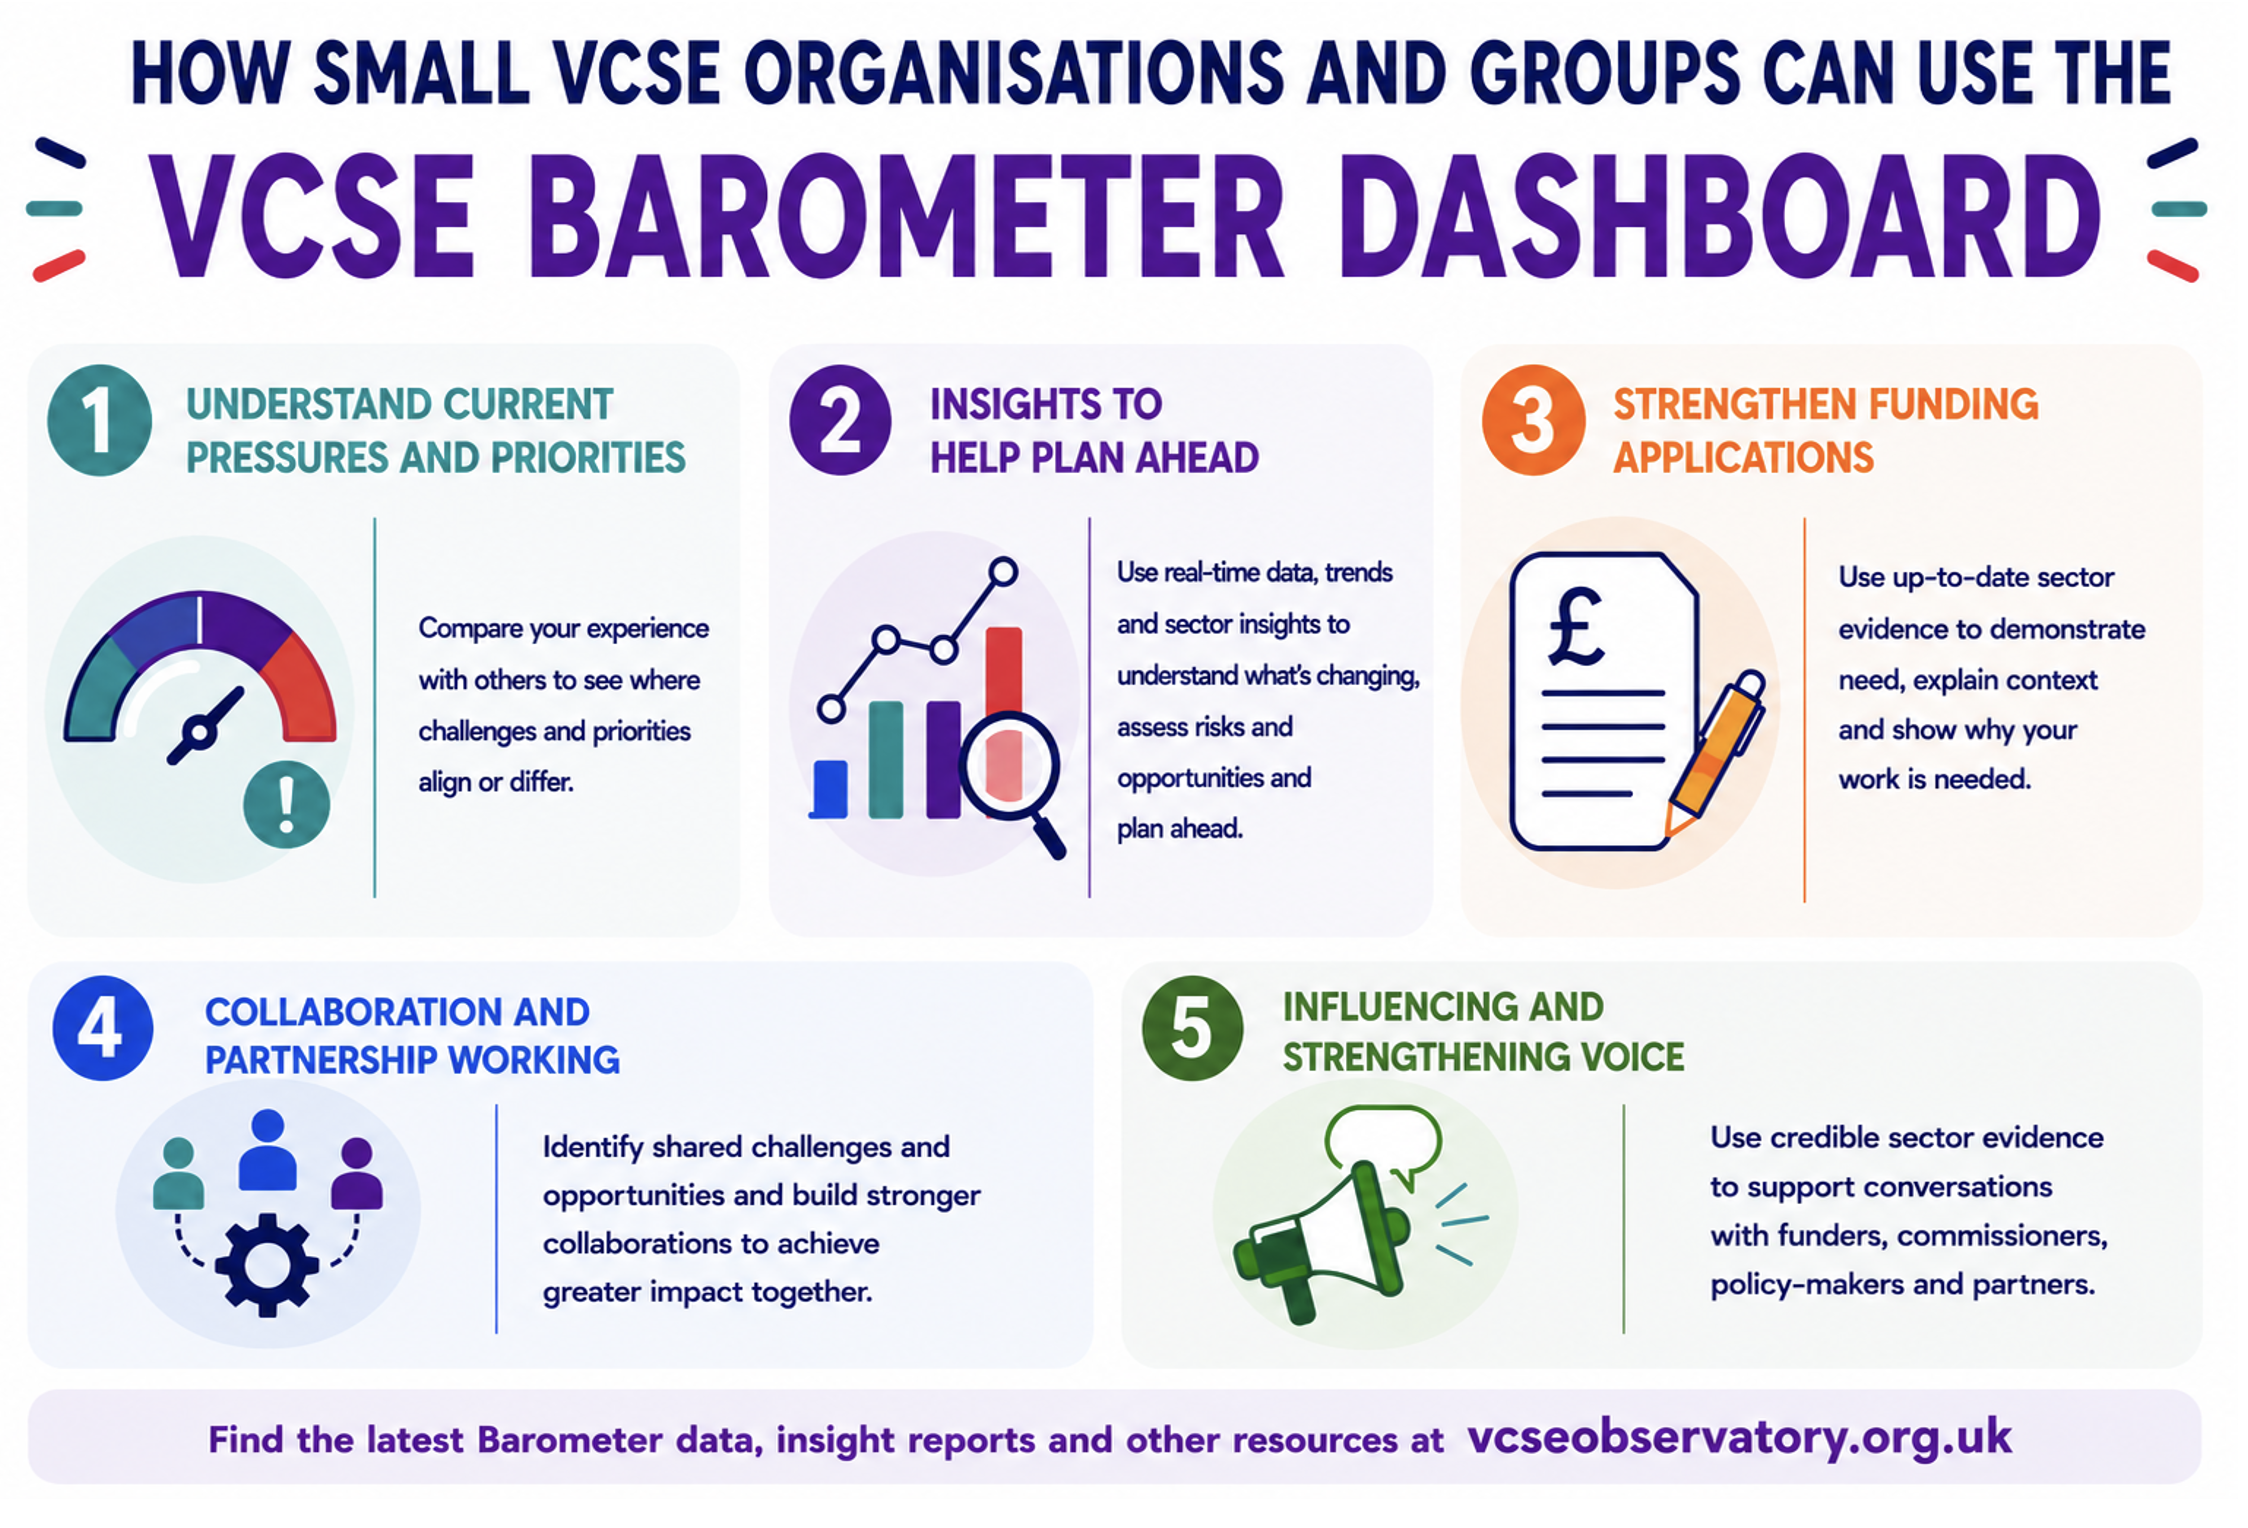
Here are five ways you can put it to work.
Understand current pressures and priorities
The Barometer Dashboard can help you understand whether the challenges you’re facing are experienced by other small VCSE organisations and groups and the wider sector. It can give you a fuller picture of what is happening outside your organisation so you can make sense of your own experiences.
Take a look at current operational pressures on the Dashboard. If you filter the data, as shown, you can just focus on small organisations and groups.
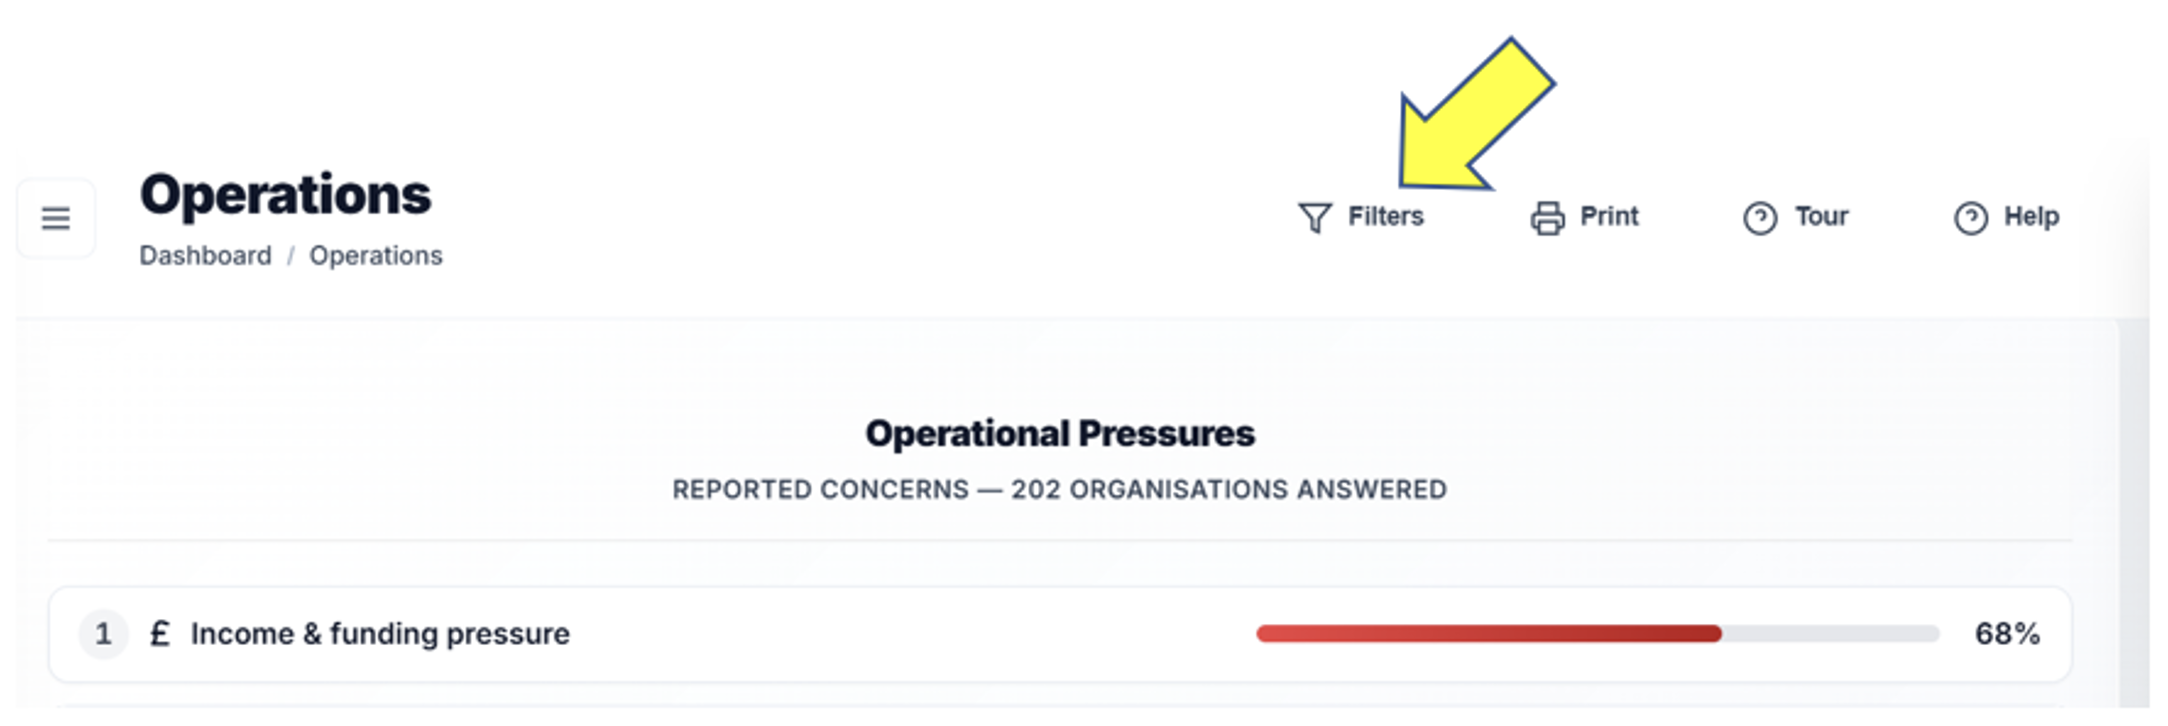
Practical Action
Get insights to help plan ahead
Understanding what is changing in the sector can support future planning. The Dashboard can help answer questions such as:
- What trends are emerging for the sector?
- What risks should we be planning for?
- What opportunities are emerging?
This is helpful for planning, reviewing priorities and informing decisions. You may find the data and infographics on future expectations and organisational outlook and on trends especially useful.
Practical Action
Strengthen funding applications
Funders often want evidence on wider context, need, demand and relevance. The Dashboard can be used alongside organisational and local data to strengthen funding applications. For example, it could help with questions such as:
- What current evidence is there of increasing demand?
- How are rising costs affecting organisations and groups?
- How does our work fit with wider challenges or priorities?
- Why is investment needed now?
Practical Action
Collaboration and partnership working
The Dashboard provides an evidence base to help organisations identify shared challenges and opportunities. For example, the latest wave 14 data shows:
Practical Action
Influencing and strengthening voice
By bringing together the experiences of different organisations and groups, the Dashboard provides evidence that can support your conversations with policy makers, funders, commissioners and partners. It can help evidence the challenges small VCSE organisations and groups are facing and support efforts to strengthen voice.
Practical Action
We hope these ideas about the ways you can use the Dashboard are useful. The Observatory would love to hear how you use the Dashboard and how it could be improved at VCSEobservatory@ntu.ac.uk
Find out more about the VCSE Observatory, the VCSE Barometer Dashboard and our wider work at vcseobservatory.org.uk or email VCSEObservatory@ntu.ac.uk
Ready to explore the Dashboard?
The VCSE Barometer Dashboard provides real-time, free-to-use data and infographics on the VCSE sector. Explore it now or get in touch to find out more about our work.